A useful report states exactly which broadcasts and dates were analysed. It summarizes verified brand appearances and screen time, shows how visible the logo was, and lets a reader trace a total back to its source and moment. It then separates measured exposure from audience context and any financial interpretation. The published Publicis/PENNY and Superbet projects provide examples of these parts, not a universal report template or a public ROI percentage.
1. Define what the report covers
The first page should identify the monitored brand and logo variants, channels or video sources, dates, and amount of material reviewed. It should say whether the analysis includes only a live event or also surrounding programmes, replays, interviews, news, and promotions. A result is only about the material inside that boundary.
The Publicis/PENNY project analysed about 1,200 hours from 10 TV stations around two national-team matches. The monitored material extended into news, training, interviews, and press conferences. The Superbet project covered approximately 3,780 hours across 14 Romanian TV channels in February 2025. Those figures describe different projects and should not be compared as if they covered the same footage.
If a headline says “total exposure,” look immediately for the channels and time window beneath it. Exposure outside the monitored sources is unknown, not zero. If a sponsorship extends beyond TV, agree separately which streaming or social videos are in scope.
2. Read the executive summary, then its definitions
A decision-maker needs a compact view of appearances, visible time, quality, and where the exposure came from. The summary should identify the reporting period and make clear whether a figure is a count of appearances, summed duration, audience measure, or estimated value. These are different quantities; placing them in one chart without labels makes a report difficult to use.
In the monitored PENNY footage, the published case study reports 24,720 logo appearances lasting at least one second. That is a count within the stated scope, not a count of unique viewers or a monetary return. The PENNY deliverables also included an executive PDF, charts, a detailed appearance table, and clips. For Superbet, the public story describes breakdowns by brand, channel, match, and banner type, with a competitor comparison.
| Part | Question it answers | Published project example |
|---|---|---|
| Coverage | Which sources and dates were monitored? | PENNY: 10 TV stations and 1,200 hours |
| Summary | How many appearances and how much visible time? | PENNY: appearance count; Superbet: brand-level exposure totals |
| Appearance detail | Which broadcast moment produced each result? | PENNY: per-appearance report extract and clips |
| Visibility quality | How large and where on screen was the logo? | Superbet: size classes and nine screen regions |
| Breakdowns | Which channels, placements, or brands differed? | Superbet: channel, match, banner, and competitor views |
| Audience context | What audience data can be connected to the exposure? | Superbet: TV ratings and share for selected groups |
The table describes fields evidenced by the two published projects. A specific client report should be scoped around the client's question; it need not include every possible breakdown.
3. Inspect the records behind a total
An executive number should lead to an appearance-level record: source, time, duration, and visibility information. Supporting clips make it possible to check the visual context when a placement is disputed or unusually prominent. AI-assisted detection can help find appearances in a large video corpus; the published BrandEye.ai projects also used human review before reporting.
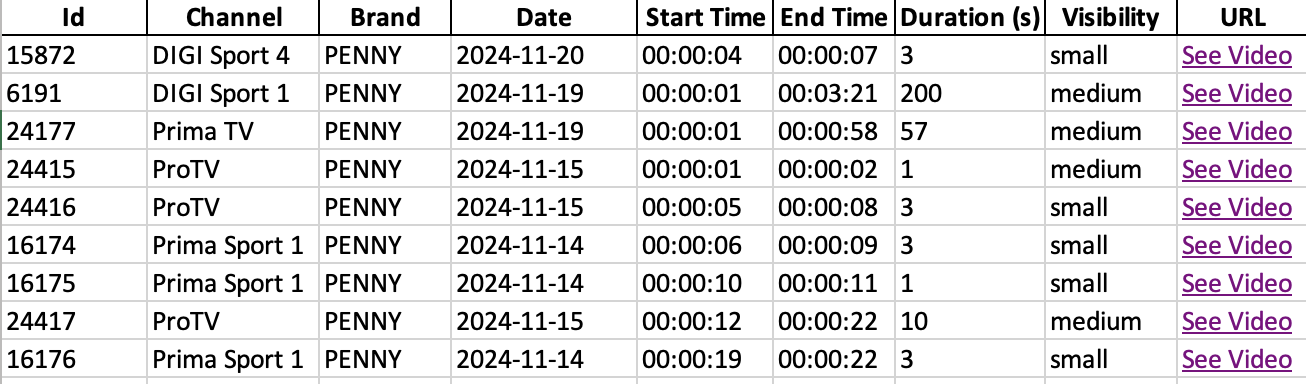
Ask whether the summary can be filtered back to the exact channel and timestamp. That connection matters more than a large appearance count: it lets the agency and client investigate anomalies, compare sources, and explain how a conclusion was reached.
4. Compare visibility, not just frequency
A logo appearing for one second at the edge of the picture is different from a larger placement held on screen. A useful report separates appearance count, duration, on-screen size, and position. It also shows how these measures change by channel, programme, placement, or competing brand when those comparisons are part of the brief.
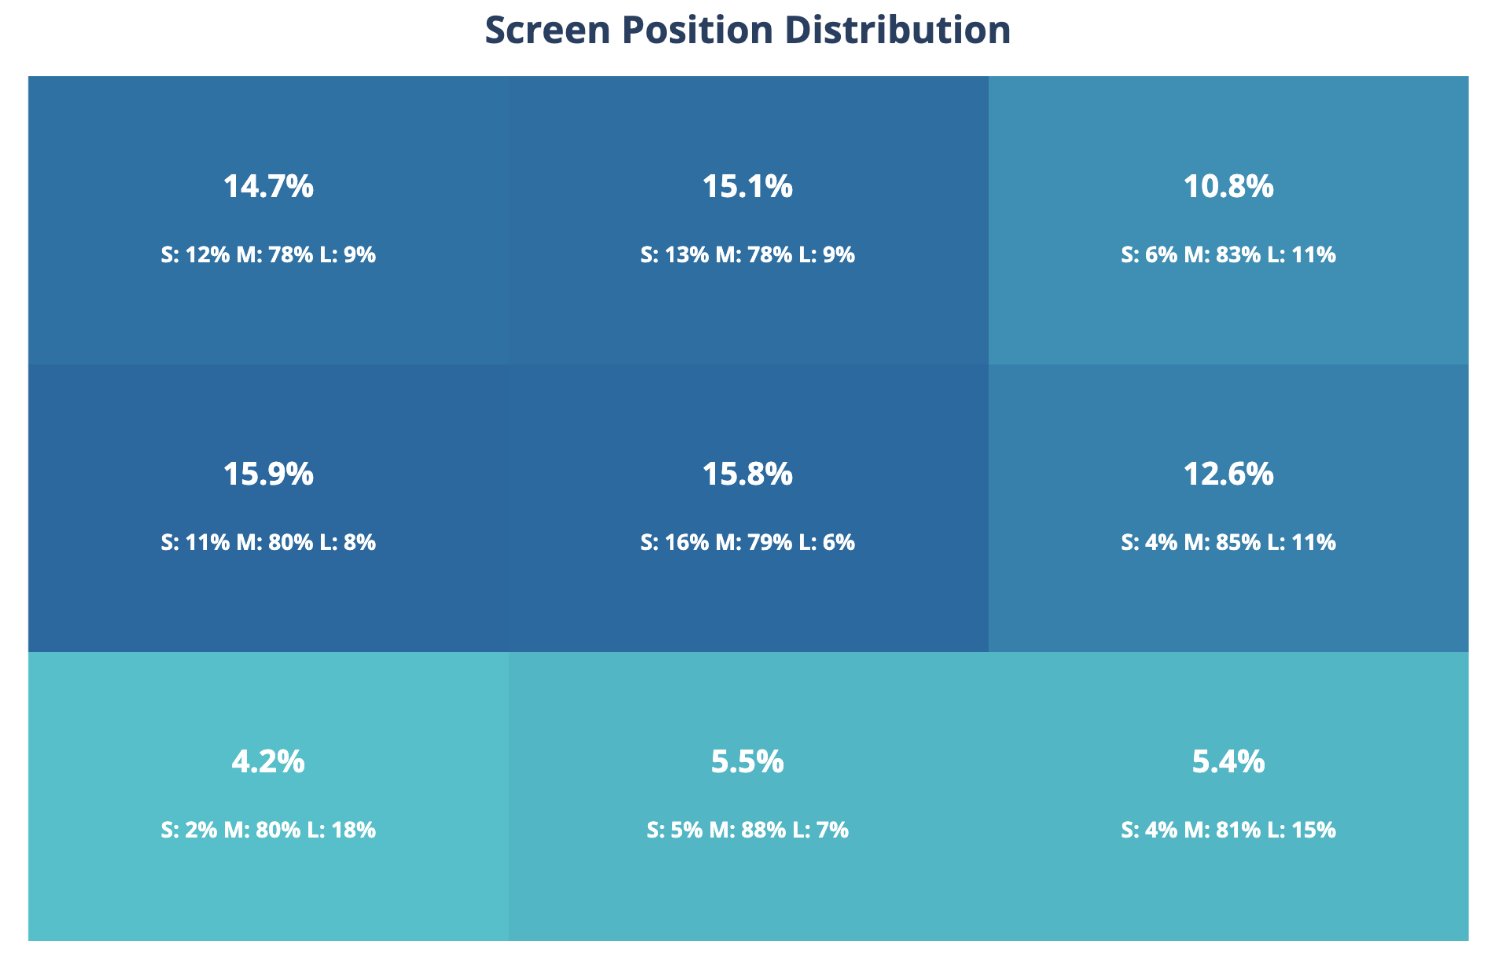
The Superbet analysis classified size as a share of screen area and position across nine screen regions. This lets the reader inspect where exposure occurred instead of assuming all appearances had equal visibility. The location of a logo on screen does not prove where viewers looked.
5. Keep audience and value separate from exposure
Exposure data describes what appeared in the analysed video. Audience data describes the viewers associated with a programme or time slot. In the Superbet project, the appearance records were connected with TV ratings and share for selected demographic groups. That makes the exposure more informative, but it does not demonstrate that every viewer noticed the logo or acted because of it.
The public PENNY and Superbet stories do not provide sponsorship costs or a financial return figure. A report should therefore label measured exposure, audience context, any estimated media value, and a financial ROI calculation separately. If a buyer wants the last of these, the investment and valuation assumptions must also be supplied and explained. The ROI guide focuses on how those layers support a decision.
6. Check what the agency and client can take away
Before commissioning work, agree what form of evidence will be handed over: an executive summary, breakdown charts, appearance records, and clips where relevant. The PENNY project publicly describes all four. A client may need a concise decision view, while an agency may also need the detail to answer questions about individual placements.
- Are the monitored channels, dates, content types, and exclusions written down?
- Can each headline metric be traced to a definition and underlying appearances?
- Are duration, logo size, and screen position reported separately?
- Do the breakdowns match the placements or competitors being evaluated?
- Is the audience source and level of matching explained?
- Are measured facts kept separate from estimated value and financial ROI?
- Can an important or disputed appearance be checked in its video context?
These questions are useful outside sport as well. The available case studies are TV sponsorship projects, while BrandEye.ai can scope measurement for other video sources. The exact sources and deliverables should be agreed for each project.
Discuss your brief
Ask what your report would include
Tell us what you need to measure and which decisions the results should support.