Measure the exposure first: each verified appearance, its duration, size, screen position, and source. Connect those records to the audience of the relevant programme and time slot. Then assess the measured value against the commercial terms of the sponsorship. The public case studies show the exposure and audience stages; they do not disclose a financial ROI percentage.
1. Set the measurement boundary
Before looking at a total, ask what was actually monitored. The answer should name the brand and logo variants, the video sources, the dates, and the parts of each source included in the analysis. An exposure figure without that boundary is difficult to interpret: it tells you nothing about the material outside the study.
The two BrandEye.ai projects illustrate different boundaries. Superbet covered approximately 3,780 hours across 14 Romanian TV channels in February 2025. The monitored content included matches, promotions, interviews, replays, and analysis programmes. Publicis/PENNY covered 1,200 hours from 10 TV stations around two national-team matches. Its report also captured news, training, and press conferences.
For PENNY, measuring only the live matches would not describe the exposure found in the surrounding programmes. For Superbet, the monthly totals make sense only alongside the channels and intervals that were monitored. In both cases, the scope is part of the result.
2. Build a verifiable appearance record
The next step is to keep the individual appearances behind every summary. In both case studies, BrandEye.ai identified logo appearances and used human review before reporting. An appearance record lets the reader go from a total back to a particular source and moment.
| Record | Question it answers | Why it matters |
|---|---|---|
| Source and timestamp | Where and when did the logo appear? | Connects the total to a specific programme or clip. |
| Duration | How long was it visible? | Distinguishes a brief appearance from sustained screen time. |
| Size and position | How much of the screen did it occupy, and where? | Adds visibility quality to the time count. |
| Review clip | What was the surrounding visual context? | Lets a person inspect an individual finding. |
PENNY's report identified 24,720 logo appearances lasting at least one second in the material it monitored. That is a useful starting figure, but the case study also describes a per-appearance table and summaries of duration, quality, timeline, and channels. Those extra views are what allow the total to be investigated.
3. Separate volume from visibility quality
An appearance count, total screen time, and visibility quality answer different questions. The count describes how often a logo was detected. Duration describes how much time it occupied. Size and position describe how it appeared on screen. Reading only one of these can hide differences between placements.
Superbet's analysis classified logo size by the percentage of screen area and position across nine screen zones. It could then compare results by channel, match, and banner type. In the monitored material, the case study reports more than 314 hours of Superbet visibility from 125,191 appearances, compared with more than 140 hours from 73,656 appearances for a competitor. The figures describe that project's coverage; they are not audience or financial-return figures.
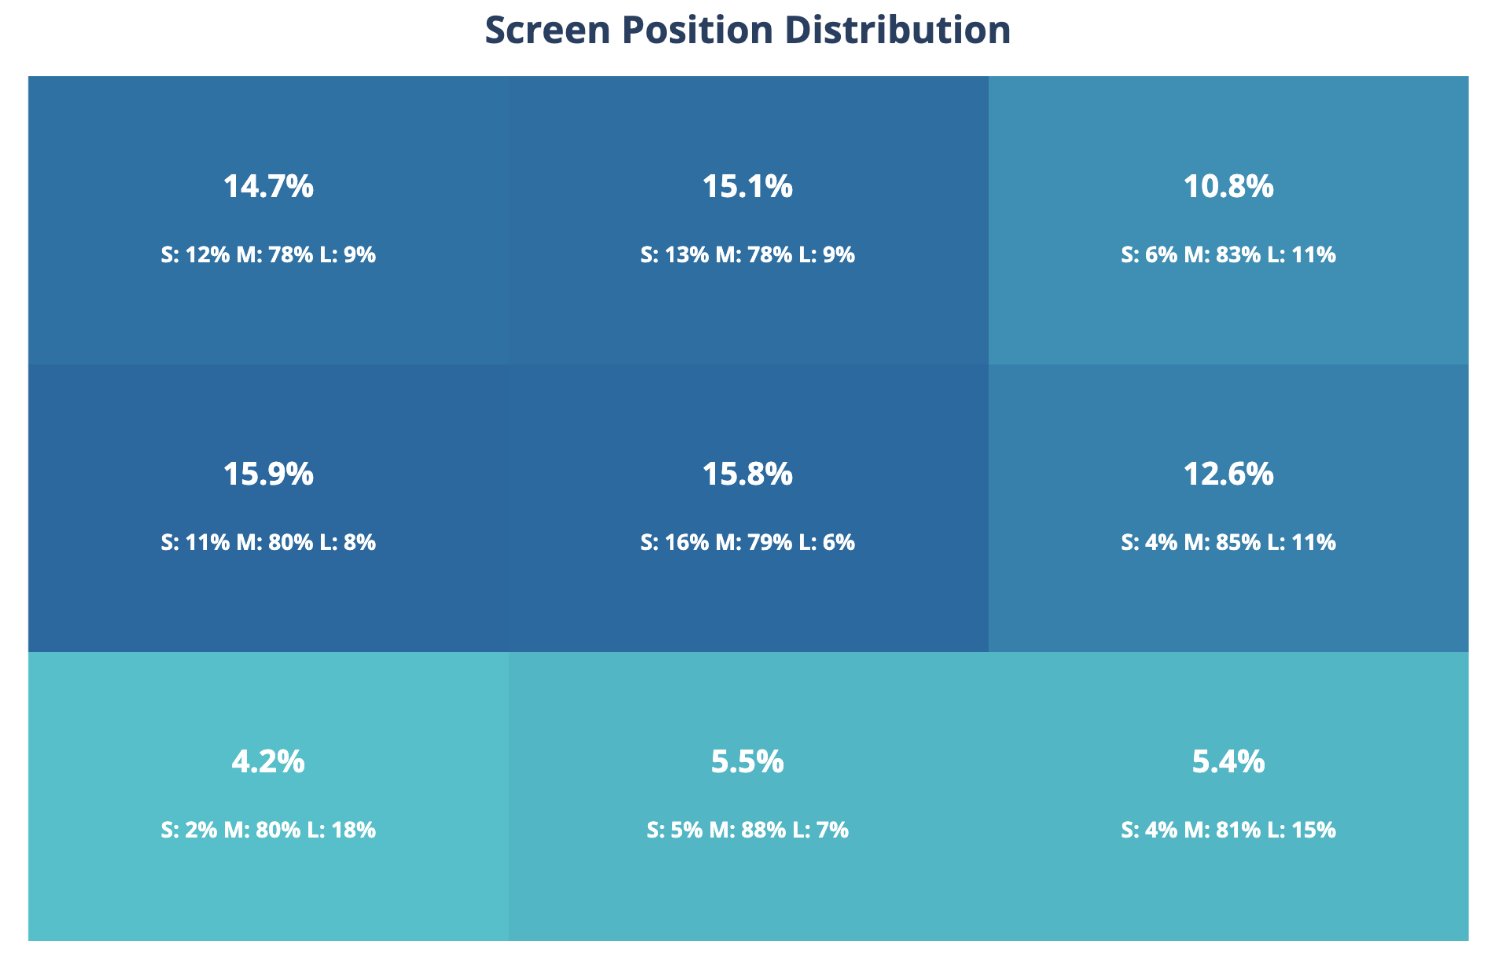
If two placements have similar appearance counts, compare their total duration, size distribution, and screen positions before calling them equivalent. The Superbet report includes those dimensions, but the public story does not publish a monetary value for each banner type.
4. Add audience context, then evaluate ROI
Video measurement tells you what was on screen. Audience data adds information about the programme and time slot in which an appearance occurred. In the Superbet project, each recorded appearance was linked to TV audience metrics, including ratings and share for selected demographic groups. The report could therefore place screen time and visibility quality beside the audience context for that appearance.
This is the point where a sponsorship discussion becomes more useful than a count of logos. The team can examine which channels, programmes, matches, and banner types delivered the measured exposure and what audience was associated with them. The case study also includes a competitor comparison. These are concrete questions a buyer can use when reviewing placements or a future sponsorship plan.
The case studies publish measured exposure and, for Superbet, the audience connection. They do not disclose the sponsorship cost or a financial return figure. A percentage ROI cannot be calculated from the public exposure totals alone. BrandEye.ai can measure the exposure and connect it to audience data; the commercial calculation must use the actual terms and valuation assumptions of the project.
5. Check whether the report answers your question
A report is useful when its summary can be traced back to the underlying video. The PENNY project delivered an executive PDF, a per-appearance table, charts, and clips. The Superbet project also produced breakdowns by brand, channel, match, and banner type. Use these examples as a checklist when discussing what your own report needs to show:
- Can I see exactly which sources and dates are included?
- Can I inspect the time, duration, size, and position behind a headline total?
- Can I compare the channels or types of placement that matter to my decision?
- Is the audience context attached to the relevant programme and time slot?
- Are clips available to check a disputed or unusually prominent appearance?
- Are measured exposure, audience context, and financial ROI clearly distinguished?
These questions apply to sponsorship exposure in video generally. The published examples happen to be sports projects; their value here is the measurement structure, not a claim that the same numbers apply to other content.
Next step
Measure the exposure behind your sponsorship
See how the analysis is structured, or tell us what you need to evaluate.